
How To: Measuring Pulsed RF Power

Introduction to Pulsed RF Waveforms – Characteristics and Measurement
Of the many types of RF waveforms in use today, pulsed waveforms remain among the most popular. Specifically, when speaking of pulsed waveforms, we are referring to the profile in the time domain. Benefits of pulsed waveforms include the ability to time division multiplex many users (channels) into specific time slots. Examples include GSM or TDMA cellular systems, which allow multiple users to share a single frequency channel. Aerospace/defense and commercial radar systems are also popular applications of pulsed waveforms. Pulsed signals in these applications are used to detect and identify specific targets.
The basic envelope of a pulse is shown in Figure 1, and some of the most common parameters of a simple pulse and a pulse train are labeled. The term envelope is used, of course, since it is understood that each pulse is modulated by an RF carrier.

The parameters of interest are pulse width, peak power, pulse repetition interval (PRI) and pulse repetition frequency (PRF). Note that PRI and PRF describe the period and frequency of the waveform, respectively, and are inversely related. The duty cycle of a pulsed waveform is defined as the pulse width divided by the PRI. In percentage terms, is it the percentage of time that energy is present during a full period of the waveform. So, it follows that the average power over one full period is proportional to the duty cycle.
Key Parameters for a Pulsed Signal
| Peak Power | Instantaneous peak power level of the pulse |
| Pulse Power | Average power during the pulse “on” time; this represents a steady-state peak power level of the pulse after averaging out any overshoot. |
| Average Power (or Cycle Power) | Average power over a complete pulse period. |
| Overshoot | Ratio of Peak Power to the Pulse Power |
| Crest Factor | Ratio of Peak Power to Average Power over the complete pulse period. |
| PAPR (Peak to Average Power Ratio) | Same as crest factor; ratio of Peak Power to Average Power over the complete pulse period. |
| Duty Cycle | Ratio of the Pulse Width divided by the Pulse Period or the Peak Power divided by the Average Power |
| Pulse Width | The pulse “on” time, measured from 50% of the pulse rising edge to 50% of the pulse falling edge |
| Pulse Period | The complete period of the pulse, including the “on” time and interval, generally measured from 50% of the pulse rising edge to 50% of the next pulse rising edge |
| PRI (Pulse Repetition Interval) | The time interval between 2 consecutive pulses, generally measured from 50% of the pulse rising edge to 50% of the next pulse rising edge |
| PRF (Pulse Repetition Frequency) | The rate at which pulses repeat (per second); this is the inverse of the PRI |
| Rise Time | Time taken from 10 to 90% of the pulse rising edge |
| Fall Time | Time taken from 90 to 10% of the pulse falling edge |
| Pulse Droop | The reduction in signal level from the start to the end of the pulse “on” time |
Table 1: Description of key pulse parameter
Non-Ideal Pulsed RF Waveforms
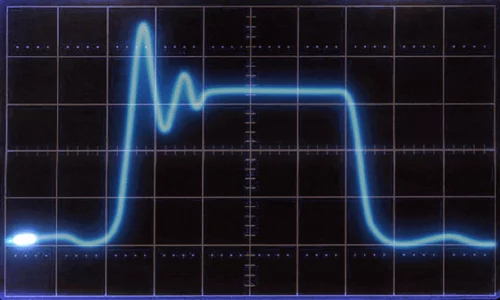
The generalized waveform shown in Figure 1 was appropriately described as an RF pulse envelope. A true RF pulse is basically a burst of an RF carrier waveform. In the simplest form of an RF pulse, the carrier is a single CW frequency. This case is shown in Figure 2a where a 1 GHz carrier is gated on for 20 ns (pulse width) every 50 ns (PRI – pulse repetition interval). Figure 2b shows the envelope of this 20 ns, 1 GHz RF pulse. Note that the rise and fall times are 1.2 ns and that the pulse width is measured between the 50% point of the rising edge and the 50% point of the falling edge of the pulse envelope. Overshoot and undershoot are shown as significant for illustration purposes. Figure 2c is designed to provide a good illustration of the RF carrier inside of the envelope that it yields when demodulated (when the RF is stripped away).


Whether by design, such as in the case of over filtering of a GSM cellular signal or as a matter of complexity such as OFDM, or even due to random errors in the environment, such as electromagnetic interference, most RF pulse waveforms will rarely appear as straightforward and uniform as the waveform in Figure 2.
When dealing with ‘real world’ RF pulses, such as waveforms that result from complex modulation schemes (OFDM/QAM, for example) parameters such as peak envelope power and average power often prove more meaningful. Selection of the correct instrument to measure these quantities is of paramount importance.
Mini-Circuits offers a range of USB power sensors capable of measuring several RF pulse power parameters across many power levels and frequencies. These can be highlighted with a simple demonstration. To begin, the Mini-Circuits’ SSG-15G-RC Synthesized Signal Generator will be used as the RF source. It is capable of producing RF pulses with either an internal or external pulse modulator. For this demonstration, the internal pulse modulator will be used. The source will be connected to the Mini-Circuits PWR-SEN-40PW-RC USB Power Sensor via a 12-inch RC coax cable. This configuration is shown in Figure 4 using the SSG-44G-RC for illustration purposes.
Basic RF Power Measurement

Next, install the GUI software for the signal generator and power sensor on the host PC. Connect the instruments to the host PC via a USB or LAN cable for each. Open each instrument’s respective GUI and select USB or LAN for power and control. The introductory screens should appear and look similar to Figure 5.

Set up the signal generator to produce an RF pulse. For demonstration purposes, set the following on the SSG:
- SSG ➡ Frequency: 4 GHz
- SSG ➡ Power Out: 0 dBm
- SSG ➡ Select Main-Power to on (button turns green).
- For the most accurate measurements, allow the signal generator and power sensor to become temperature stable before proceeding.
- SSG ➡ Set RF OFF button to red for the moment
- SSG ➡ Press the Apply button to set the values in the SSG
Set up the power sensor to measure an RF pulse.
- PS ➡ Frequency: 4 GHz.
As a check before proceeding with an RF pulse measurement, the power sensor can be used to measure the power of a CW waveform using the RF power versus time graph. This is shown in Figure 6.
- PS ➡ Display Graph (check box)
- A graph will appear below the main power sensor GUI window.
- SSG ➡ RF ON (button turns green)
- Observe a constant power level (with respect to time) on the graph with a value similar to that set on the signal generator.
- PS ➡ Display Graph (un-check box)

The signal generator is outputting a CW signal at 0 dBm and the sensor is measuring -1.31 dBm, with the difference accounted for by the insertion loss of the interconnecting cables.
Pulsed RF Power Measurement
- Next, the signal generator will be set to create an RF pulse
- SSG ➡ Select the Pulse Mode button near the top of the SSG GUI
- A Pulse Mode window will appear. For the purposes of this demonstration, set the pulse width to 10 μsand period to 40 μs
- SSG ➡ Pulse Source select Free Run
- This creates a regular/repeating pulse sequence
- SSG ➡ Select Run Pulse in the lower right of the SSG GUI. See Figure 7 for more details

Now, set the RF power sensor to measure the pulse
- PS ➡ Frequency: 4 GHz
- Ensure the frequency is set to 4 GHz on the power sensor GUI
- PS ➡ Select the Config button in the lower right corner of the power sensor GUI
- PS ➡ Enter a Sample Period of 100 µs
- We recommend setting a sample time initially that is approximately 2 or more times the period of the pulsed signal to allow the sensor to display 2 or more complete periods. The sample period can subsequently be adjusted up or down as needed to control the resolution
- PS ➡ Set Trigger Mode to Internal
- The internal trigger mode starts a measurement when a rising edge is detected in the pulsed signal input
- PS ➡ Set Trigger Level to -10 dBm
- PS ➡ Set Select Filter to Filter Off
- PS ➡ External Output to Video
- PS ➡ Select Apply
- PS ➡ In the lower left of the PS GUI, select Pulse Profile as shown in Figure 8

Figure 9 shows the shape of the RF pulse in the lower half of the Pulse Profile Trace window. In the upper right are the Calculated Parameters of the RF pulse in table form. Also, in the upper right is a zoom window that can be selected by right clicking and holding the mouse button to drag and select a section of time from the main waveform display.

In addition to these core measurements, trigger modes, autoscale, CW measurements, markers, filtering and many more tools are available to the user. Mini-Circuits has provided these tools to enhance the user’s measurement and characterization capabilities.
Pulse Droop
Markers can also be used to derive additional information about the pulsed signal, including pulse droop. Pulse droop is a measure of the gradual reduction in a given RF pulse’s signal level from the beginning to the end of its “on” time, which is the time between the rising and falling edges. This parameter is particularly meaningful in characterization of pulsed radar systems where the output power amplifier may struggle to maintain the RF output power level over the entire duration of the pulse, often due to internal device heating effects and local storage capacitance limits.
Utilizing the same signal setup, to measure pulse droop for the signal shown in Figure 9:
- In the main graph display, click and hold the right mouse button to select just the “on” time of a single pulse
- The “zoom” graph display will appear (see Figure 10), focused on this section of the pulse
- Drag marker 1 in the zoom graph to the start of the pulse “on” time
- Drag marker 2 in the zoom graph to the end of the pulse “on” time
- The marker summary in the top right corner of the zoom graph summarizes the absolute values of the 2 markers (time elapsed since the trigger and the signal level in dBm)
- The delta table in the bottom right corner of the zoom graph gives the difference between the 2 markers
- Delta time is the pulse “on” time
- Delta dB is the difference in power level between the two markers, also known as pulse droop

Summary
Power is a necessary parameter to measure across a wide range of modern applications and there are an assortment of instruments and methods for measuring it. Best practices, such as high-quality connectors and properly torqued components from Mini-Circuits can help minimize errors in any RF measurement. With high-performance test systems, the user should take great care to understand ways of minimizing any source of measurement error.
For measuring RF power and other pulse-modulated RF waveform characteristics, Mini-Circuits’ RF power sensors offer the convenience of modern connectivity (USB, LAN), an interactive power GUI, exceptional accuracy, and outstanding price points compared with other types of RF instrumentation.
Conclusion
Mini-Circuits’ PWR series is an example of a broad family of USB and Ethernet controlled power sensors that provide exceptional performance at competitive price points. Wideband sensors are available in a series of useful frequency ranges up to 40 GHz, with fast measurement speeds, excellent accuracy, and up to 80 dB of dynamic range. The included GUI software, shown in Figure 11, provides full power measurement capabilities from any Windows PC, and the API (Application Programming Interface) allows power measurements to be automated through most common programming environments (including Python, MatLab, LabVIEW and any more).

Modern applications require the measurement of RF power and users have many choices for instruments best suited to their requirements. USB or LAN power sensors are an excellent choice for many applications. When properly implemented, they offer excellent measurement accuracy, a competitive price point, and simple connectivity combined with a PC-based GUI. Mini-Circuits has a variety of power sensors to meet a wide range of modern applications. A list of Mini-Circuits’ power sensors and their capabilities can be found at:
As Mini-Circuits continues to enhance and broaden its line of power sensors and other measurement solutions, we invite you to periodically visit Mini-Circuits’ web site and follow the evolution and expansion of our RF test products.
Mini-Circuits PWR Compatibility Matrix
| Signal Types | Measurement Type | |||||
| P/N | CW | Pulsed | Multi-Tone | Modulated | Average | Peak / Statistical |
| PWR-6RMS-RC | Yes | >10% duty | Yes | Yes | Yes | |
| PWR-9RMS-RC | Yes | >2% duty | Yes | Yes | Yes | |
| PWR-18RMS-RC | Yes | >2% duty | Yes | Yes | Yes | |
| PWR-8P-RC | Yes | 3.5 µs resolution | 100 kHz BW | Yes | Yes | |
| PWR-8PW-RC | Yes | 35 ns resolution | 10 MHz BW | Yes | Yes | |
| PWR-9PWHS-RC | Yes | 35 ns resolution | 10 MHz BW | Yes | Yes | |
| PWR-18PWHS-RC | Yes | 13 ns resolution | 30 MHz BW | Yes | Yes | |
| PWR-40PW-RC | Yes | 35 ns resolution | 10 MHz BW | Yes | Yes | |